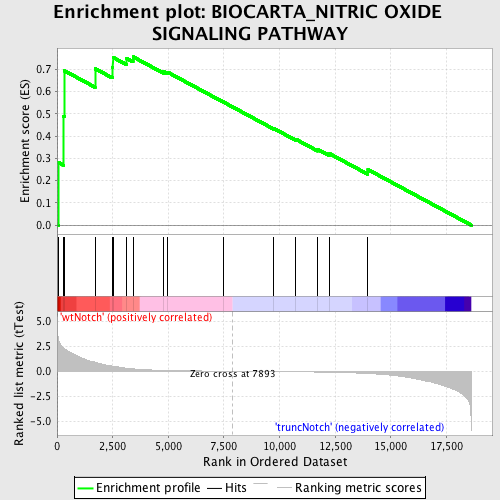
Profile of the Running ES Score & Positions of GeneSet Members on the Rank Ordered List
| Dataset | Set_03_truncNotch_versus_wtNotch.phenotype_truncNotch_versus_wtNotch.cls #wtNotch_versus_truncNotch.phenotype_truncNotch_versus_wtNotch.cls #wtNotch_versus_truncNotch_repos |
| Phenotype | phenotype_truncNotch_versus_wtNotch.cls#wtNotch_versus_truncNotch_repos |
| Upregulated in class | wtNotch |
| GeneSet | BIOCARTA_NITRIC OXIDE SIGNALING PATHWAY |
| Enrichment Score (ES) | 0.756034 |
| Normalized Enrichment Score (NES) | 1.6016141 |
| Nominal p-value | 0.0024213076 |
| FDR q-value | 0.2406998 |
| FWER p-Value | 0.951 |
| PROBE | DESCRIPTION (from dataset) | GENE SYMBOL | GENE_TITLE | RANK IN GENE LIST | RANK METRIC SCORE | RUNNING ES | CORE ENRICHMENT | |
|---|---|---|---|---|---|---|---|---|
| 1 | PRKAR1A | 3450369 | 66 | 3.071 | 0.2808 | Yes | ||
| 2 | PPP3CB | 6020156 | 277 | 2.375 | 0.4894 | Yes | ||
| 3 | PRKACB | 4210170 | 339 | 2.235 | 0.6930 | Yes | ||
| 4 | PPP3CC | 2450139 | 1709 | 0.903 | 0.7030 | Yes | ||
| 5 | PRKAR2A | 2340136 | 2483 | 0.512 | 0.7088 | Yes | ||
| 6 | PRKAR2B | 3130593 5220577 | 2512 | 0.501 | 0.7536 | Yes | ||
| 7 | CAMK2B | 2760041 | 3126 | 0.306 | 0.7490 | Yes | ||
| 8 | PPP3CA | 4760332 6760092 | 3415 | 0.243 | 0.7560 | Yes | ||
| 9 | GRIN2D | 6620372 | 4791 | 0.083 | 0.6898 | No | ||
| 10 | GRIN2B | 3800333 | 4982 | 0.074 | 0.6864 | No | ||
| 11 | NOS1 | 5860129 | 7463 | 0.007 | 0.5537 | No | ||
| 12 | GRIN1 | 3800014 7000609 | 9746 | -0.031 | 0.4339 | No | ||
| 13 | PRKAR1B | 6130411 | 10735 | -0.052 | 0.3856 | No | ||
| 14 | GRIN2A | 6550538 | 11714 | -0.080 | 0.3404 | No | ||
| 15 | GRIN2C | 1500538 | 12256 | -0.101 | 0.3207 | No | ||
| 16 | PRKCA | 6400551 | 13971 | -0.229 | 0.2497 | No |

